A map of my readers
By Yanina Bellini Saibene
November 13, 2022
Generating content is time-consuming and making it bilingual takes even more time. So with the intention of using my time in the best possible way, I started asking myself if the effort of writing in Spanish and English is something that is useful to other people, besides me.
Website statistics
So the first thing that came to my mind is to start getting statistics on where people visit my site and what content they consume the most.
There are many options for obtaining this type of statistics, from Google Analytics to Pausible.io, and most of them can give you a list of countries with the number of users that visited your site.
My dataset has 3 variables: Position (the ranking), Country (the name), Users (total number). With that info and rstats I can make a map that show me from where are people reading what I wrote.
The Map
I use the following packages:
- {tidyverse} for reading the CSV file with the data (
read_csv), to wrangling the data (anti_join,mutate,case_when,%>%), and to draw the map (ggplot). - {rnaturalearth} for access to the polygons of the countries of the world (
ne_countries). - {viridis} for the color scale of the map.
- {ggthemes} to apply the
theme_map()to our map.
First step. Load the packages and read the data
library(tidyverse)
library(rnaturalearth)
library(viridis)
library(ggthemes)

stats_webpage <- read_csv("stats_personal_webpage.csv")
mapa <- ne_countries(returnclass = "sf")
Second step. Add the info to the map
The countries' data have several variables with different version of the names of the nations, some of which are according to standards. We need to check if we can join the data we read from the CSV (now stored in stats_webpage) with the data with the polygons of the countries (now stored in mapa) by some of these variables.
I use the anti_join function because returns the rows in one dataset that are not in the other.
paises <- stats_webpage %>%
  anti_join(mapa, by = c("Country" = "brk_name")) %>%
  select(Country)
In the example I use the variable brk_name to do an anti_join with the variable Country. In this particular case, this function returns the names of the countries that are in the user data but are not in the country polygons.
The results show two countries can’t be join: Czechia and Dominican Republic. With this information, we can check how the names are written in both variables used in the join, and we can update the data using a mutate and a case_when so they can be joined.
stats_webpage <- stats_webpage %>%
    mutate(Country = case_when(
    Country == 'Czechia'	~ 'Czech Rep.',
    Country == 'Dominican Republic'	~ 'Dominican Rep.',
    TRUE ~ Country))
Now that we have all the user data associated to the country polygon we can make the map using ggplot:
- The function
geom_sfallow ggplot to make maps using vector data, in this case polygons. - The function
scale_fill_viridisprovide us a scale to paint the map. - We use
theme_map()andtheme()to get a clean minimal map and remove the legend.
ggplot() +
  geom_sf(data = mapa, aes(fill = Users), color = "grey95", size = 0.01) +
  scale_fill_viridis(
    trans = "log",
    breaks = scales::log_breaks(),
    direction = -1,
    option = "G") +
  theme_map() +
  theme(legend.position = "none") +
  coord_sf(ylim = c(-55, 90))
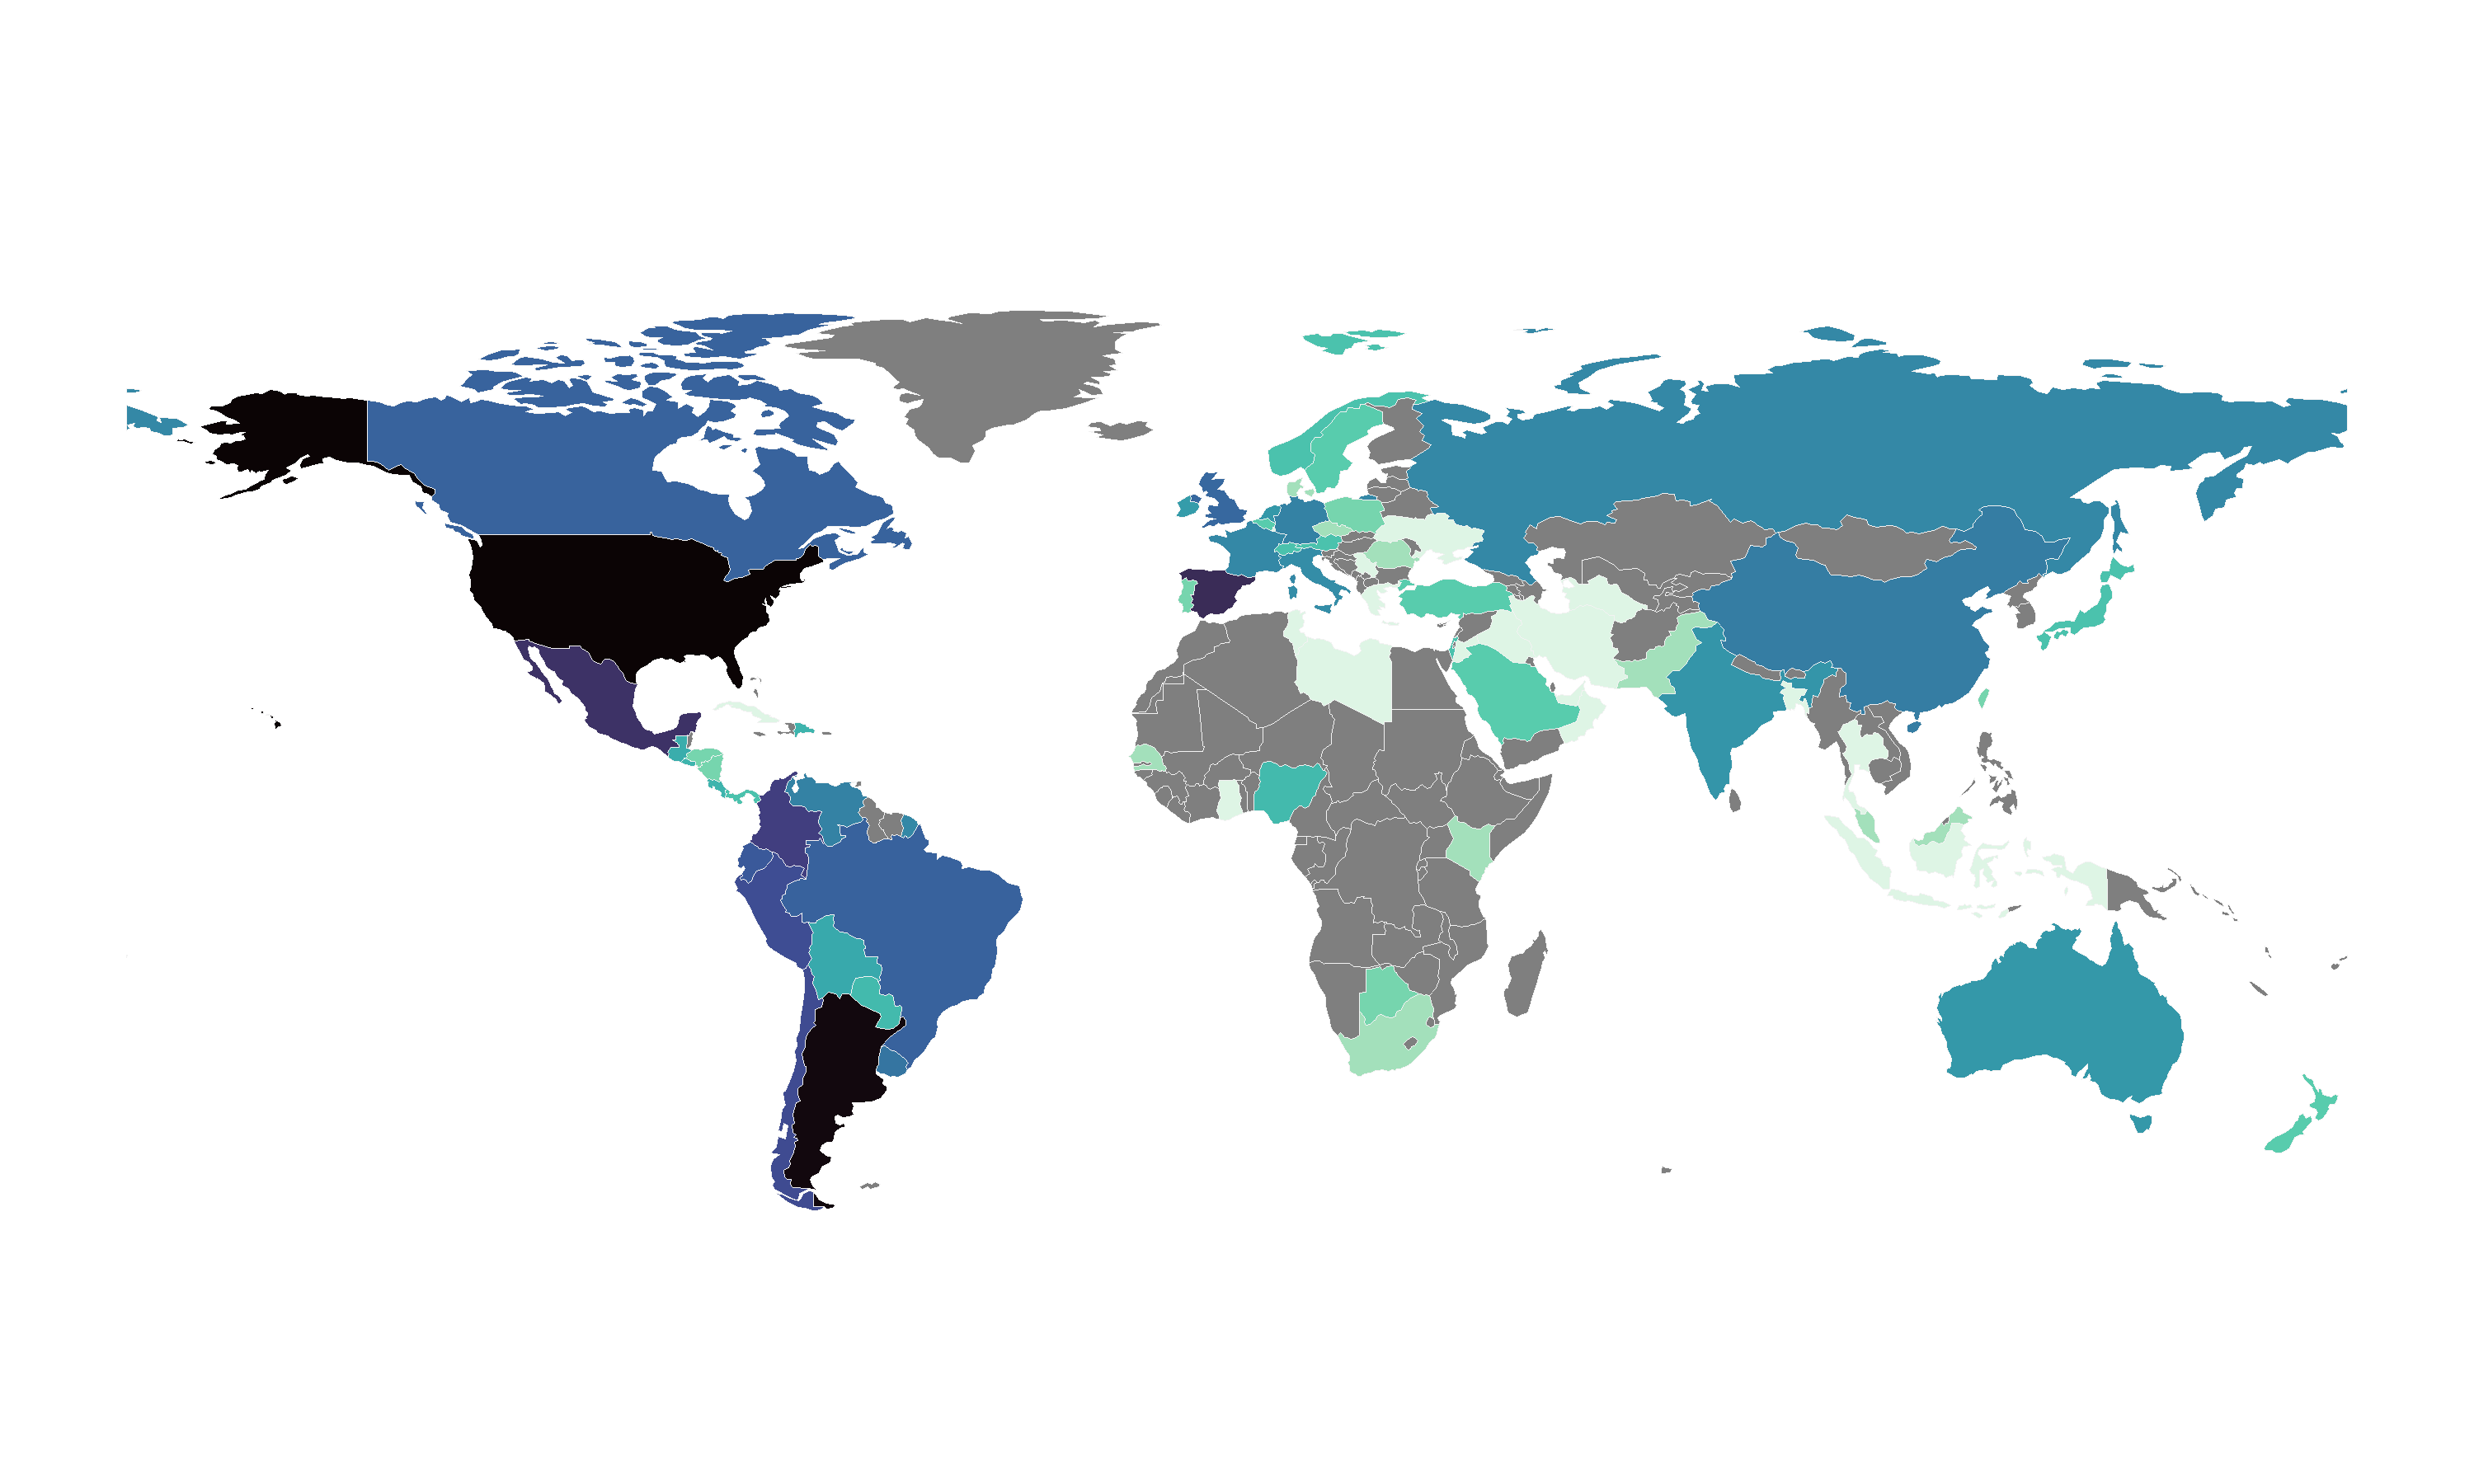
And here is the final result, a map with all the readers' countries painted by the number of users accessing my website.
We can save the map using ggsave
ggsave("users_per_countries.png", dpi = 300, width = 10, height = 6)
The resulting map, besides astonishing me by the list of 74 countries from which at least one person has read my content, convinced me that the effort of trying to generate bilingual content can help more people.
What about you? Do you write some blog post?, Do you have some maps from your users?
- Posted on:
- November 13, 2022
- Length:
- 3 minute read, 629 words