Packaging interactive tutorials
By Yanina Bellini Saibene in Community Education English rstats
May 21, 2020
On May 12, #30díasdegráficos (30 days of plots) with R, started. This is an initiative of the Spanish-speaking community of R to remember Florence Nightingale and learn about data visualization.
The challenge: create and share a graphic a day. More info on how to participate here
Since I could not participate making the graphics for each day, I generated this mini tutorial using the learnr package (my new favorite package) where I explain how to make a series of graphics with ggplot2. If you like it, I promise to improve it and add graphics to it. If you want to collaborate
here is the repo
My goals to generate this tutorial were:
- learn how to generate a tutorial package developed in learnr. I use the “Package Development" LatinR 2019 tutorial materia by Hadley Wickham.
- include in the tutorial a series of pedagogical tools described in the book Teaching Tech Together
- that you could take advantage of the new Tutorial panel that comes in the new version of RStudio.
- learn how to change the tutorial styles based on this post
- to make a contribution to the celebration of Florence Nightingale
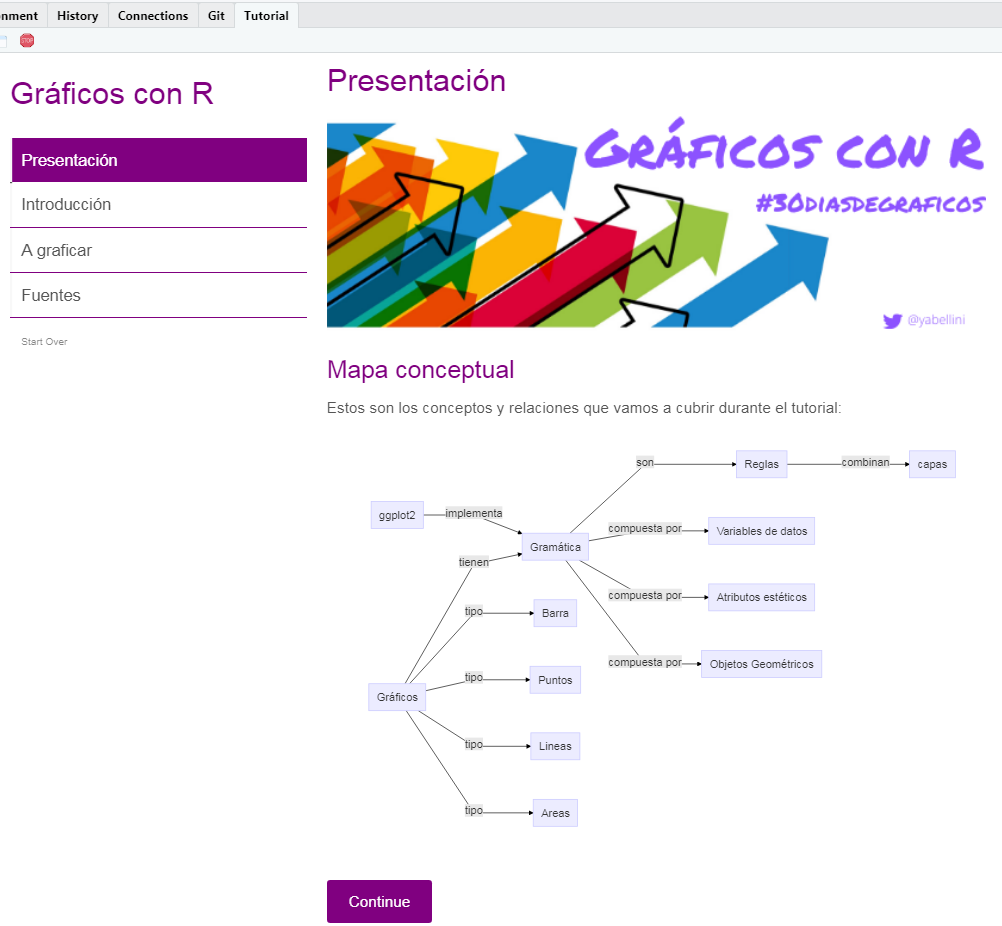
That is why the tutorial includes a concept map with the topics it covers, two learner personas wich represent the people I thought about when I build the tutorial, the license, a series of explanations and exercises to make plots with R-and the sources.
To install the package you have to download the
.tar.gz or
.zip (only for Windows) file and install the tutorialgRaficosFN package from the option Tools -> Install Packages -> Install from -> Package Archive File (.zip; .tar.gz). If you have the latest version of RStudio it will appear in your Tutorial panel.
If you don’t have the latest version then you have to install the learnr package and then run the Tutorial like this:
learnr::run_tutorial("graficos", package = "TutorialgRaficosFN")
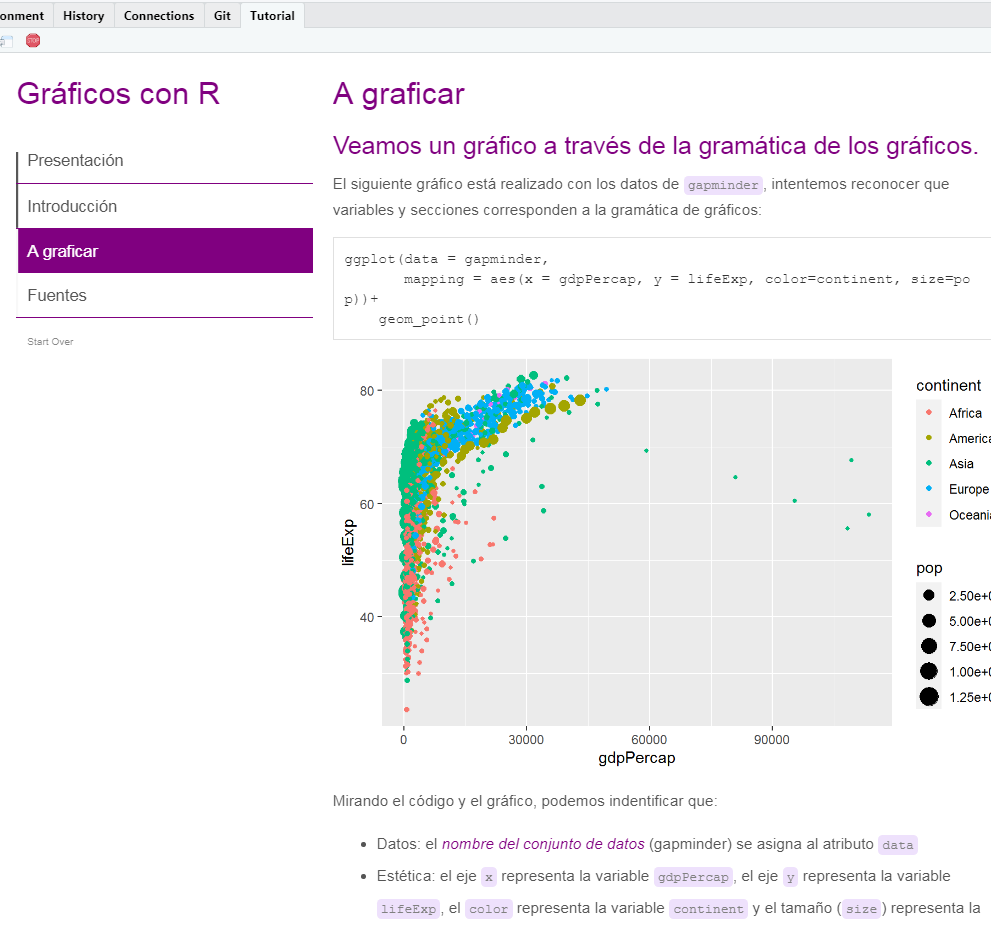
Here’s what the tutorial looks like when it’s running:
I hope this is useful and fun …. I had fun and learned a lot building it.
- Posted on:
- May 21, 2020
- Length:
- 2 minute read, 337 words